Deciphering Deadlocks the easy way.
- Oct 24, 2023
- 4 min read
Deadlocks, you love them right? They jump in at the most opportunistic moment, and cause havoc to our critical workloads. Either a critical load job is the victim, and bails out at 4 in the morning, or the CEO is running a report* and get a horrible error message so want it fixing 10 minutes ago. How can we make sure we capture them for analysis, and how do we analyse them quickly?
*CEOs don't run reports. CEOs have people who run reports for them.
I've also included a REALLY useful bit of functionality in a common free tool that you may not expect. Simply scroll to the to the end for it if you're up to speed with Deadlocks already, or don't want to read my inane rambles.
So we know what a deadlock is, multiple queries all contending for resources, one query holds some resources and is waiting on resources that another query has. That second query isn't giving the resources up and is waiting for resources that the first query has. Both are stubborn, neither are releasing what they have until they completed...so we have a standoff.
The SQL Lock monitor thread monitors for the above situation every 5 sec by default, dropping to as low as every 100ms dependent on how frequent deadlocks are found.
When a deadlock is found, the SQL server Engine will automatically kills and performs rollback on the session that has the least work to roll back, ie... that has written less (by default, no mention of priorities here). A 1205 error is then returned to the application.
Msg 1205, Level 13, State 45, Line 7
Transaction (Process ID XX) was deadlocked on lock resources with another process and has been chosen as the deadlock victim. Rerun the transaction.
Unlucky...do try again...
Details, details, where for art thou?
There are several places where we can look for deadlocks, some require configuration, some are present out of the box. Naturally, there is great support for deadlock capturing within Extended Events, which i'll always recommend as you all know I love profiler (*spit*).
I've done nothing, nowt, zip, diddley squat, zilch to my SQL config? Can I see deadlocks?
You can, if you're quick and you haven't wrapped your ring buffer or System_health file targets.
System Health Extended Event
By default, SQL creates and starts a system_health Extended event,

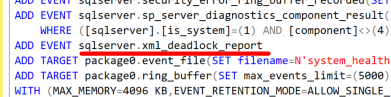
Quickly scripting this out shows that the xml_deadlock_report event is included. Great.
SQL Error Log
You can pipe the Deadlock output in xml format to the SQL Error log. Yes, its in text format, and takes a little bit of reading, but its there. In order for this to be logged, then you need to turn on a Trace flag globally (or two).
These are Trace Flag 1204 and Trace Flag 1222, both provide the same basic information, but...
1204 formats by each node involved in the deadlock
and...
1222 formats deadlock information, first by processes and then by resources.
NOTE: MS state NOT to use the trace flags on high workload systems that are experiencing deadlocks. I've never seen an issue, but definitely go with what the MS mothership says!
Extended Events
"Ah, but you've already said this above, in the System Health Extended Event.". This is true, but that can wrap quickly so events may be lost AND there are other Events you can add to give you more detail around what is going on. Or just add the Events from the System_health Xevent, and store it to a larger file target.
You can try to query the system health to get deadlock information if you like. The below will give you the xml.
USE master;
SELECT xed.value('@timestamp', 'datetime') as Creation_Date, xed.query('.') AS Extend_Event
FROM
(       SELECT CAST([target_data] AS XML) AS Target_Data
       FROM sys.dm_xe_session_targets AS xt INNER JOIN sys.dm_xe_sessions AS xs
       ON xs.address = xt.event_session_address
       WHERE xs.name = N'system_health'
       AND xt.target_name = N'ring_buffer'
) AS XML_Data
CROSS APPLY Target_Data.nodes('RingBufferTarget/event[@name="xml_deadlock_report"]') AS XEventData(xed)
ORDER BY Creation_Date DESC;
Often it can be faster to filter it through the GUI, as in this case does have its benefits with deadlocks.
Open the System_health, package0.event_file
Sort by name (so deadlocks are last), and find your xml_deadlock_report
Here, you can either copy the xml out for review...

Or click on the 'Deadlock Tab', to get the Deadlock Graph to give you a natty little picture of who lived, who died, and what they were arguing about in the first place.
Hover over an image to get context of what was running.

Thats usually enough, with simple deadlocks like the above, but when there are multiple sessions involved, things can get a little bit trickier.
SQL Sentry Plan Explorer to the Rescue.
Yes, you heard me... I haven't gone crazy (yet).
You do have Plan Explorer in your toolbox, don't you? If not, we both need to evaluate our insanity levels.
Go back to the Details tab in the xml_deadlock_report above.
Double click the value field to open the xml.
It will look something like this:

Now in SSMS, go to File > Save {query_window_name} as:
Save it somewhere, as xml, but rename it to .xdl

Open SQL Sentry Plan Explorer.

Find your file... oh look, xdl files are supported file types for Deadlocks.
Now Plan Explorer gives you the breakdown of the deadlock details.

Looks pretty similar doesn't it? So what's so special?

This. At the bottom of the screen.
Click the Play button.
The deadlock will start to play out in the order it happened. Showing you what locks were taken when, by whom, and then which was the victim.


Wow, I LOVE that. Your complicated multi session deadlocks may have just become a little easier to unpick, or certainly a whole lot faster to do so.
So for a tool that is primarily aimed at SQL Execution Plan analysis, its got quite impressive secondary skills as well.
I love this tool.
I love you all.
Rod(victim)


Comments